Heat Maps
These heat maps summarize fold-change data for different cancer types.
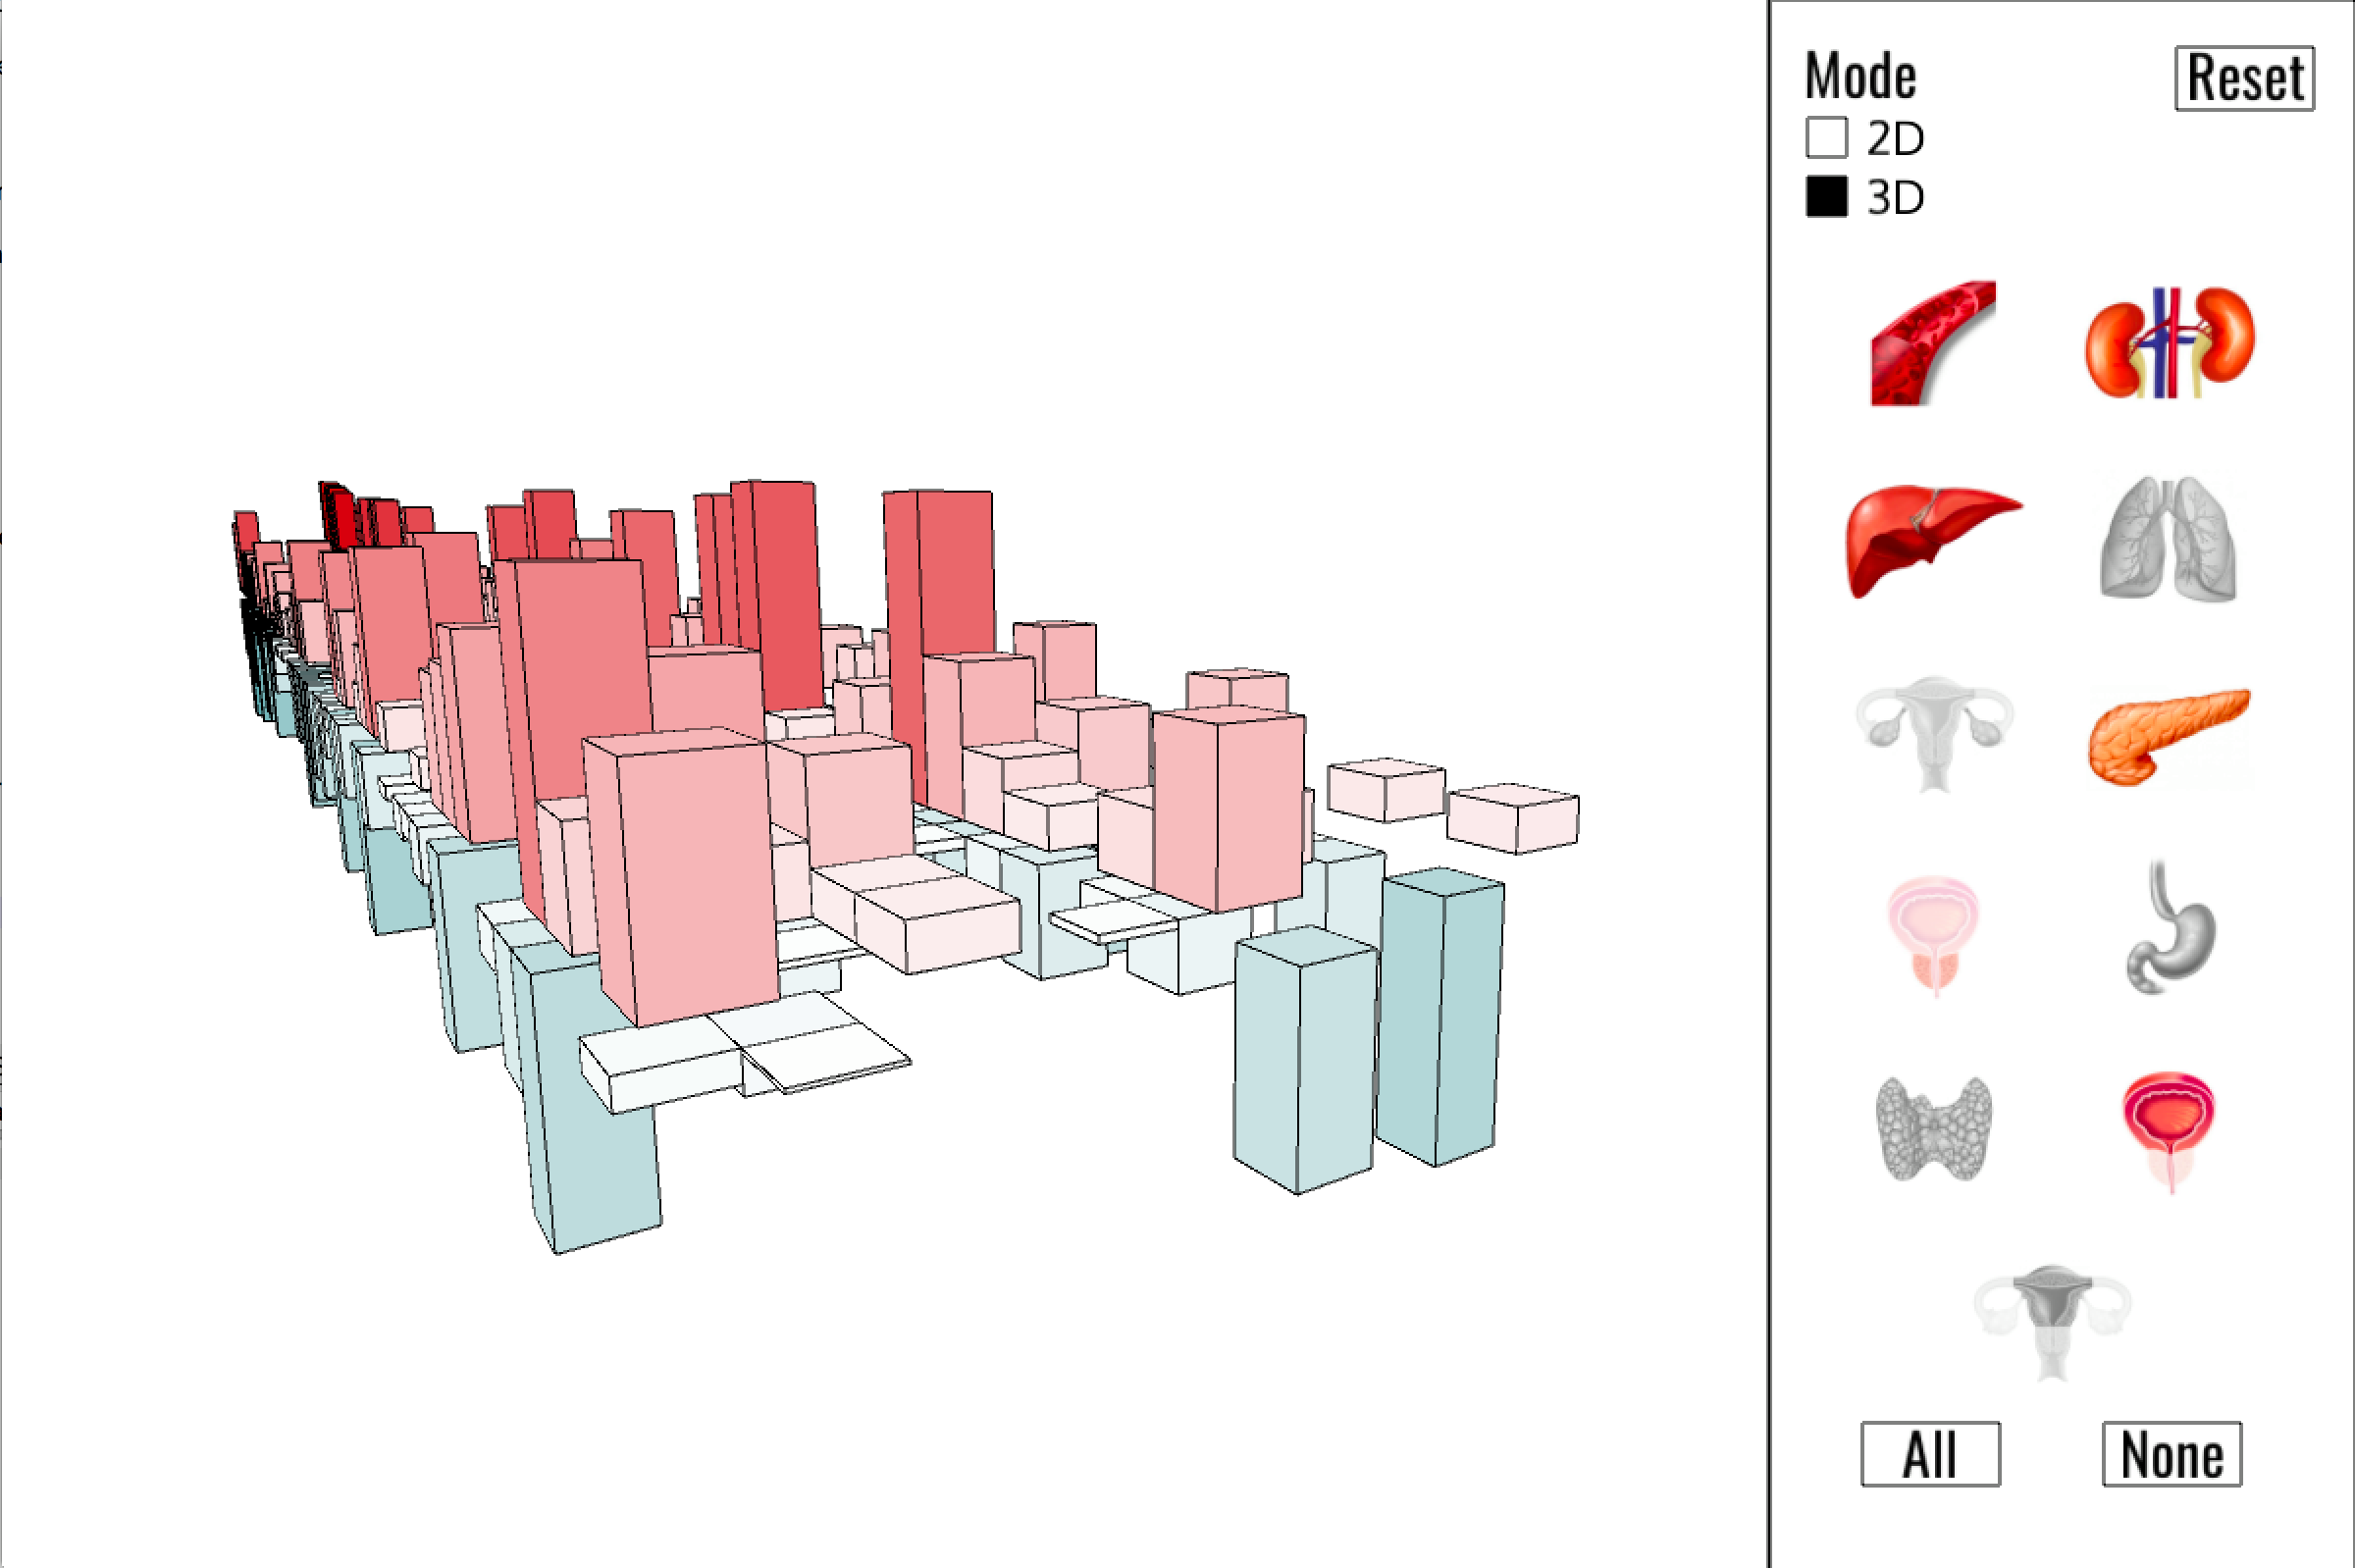
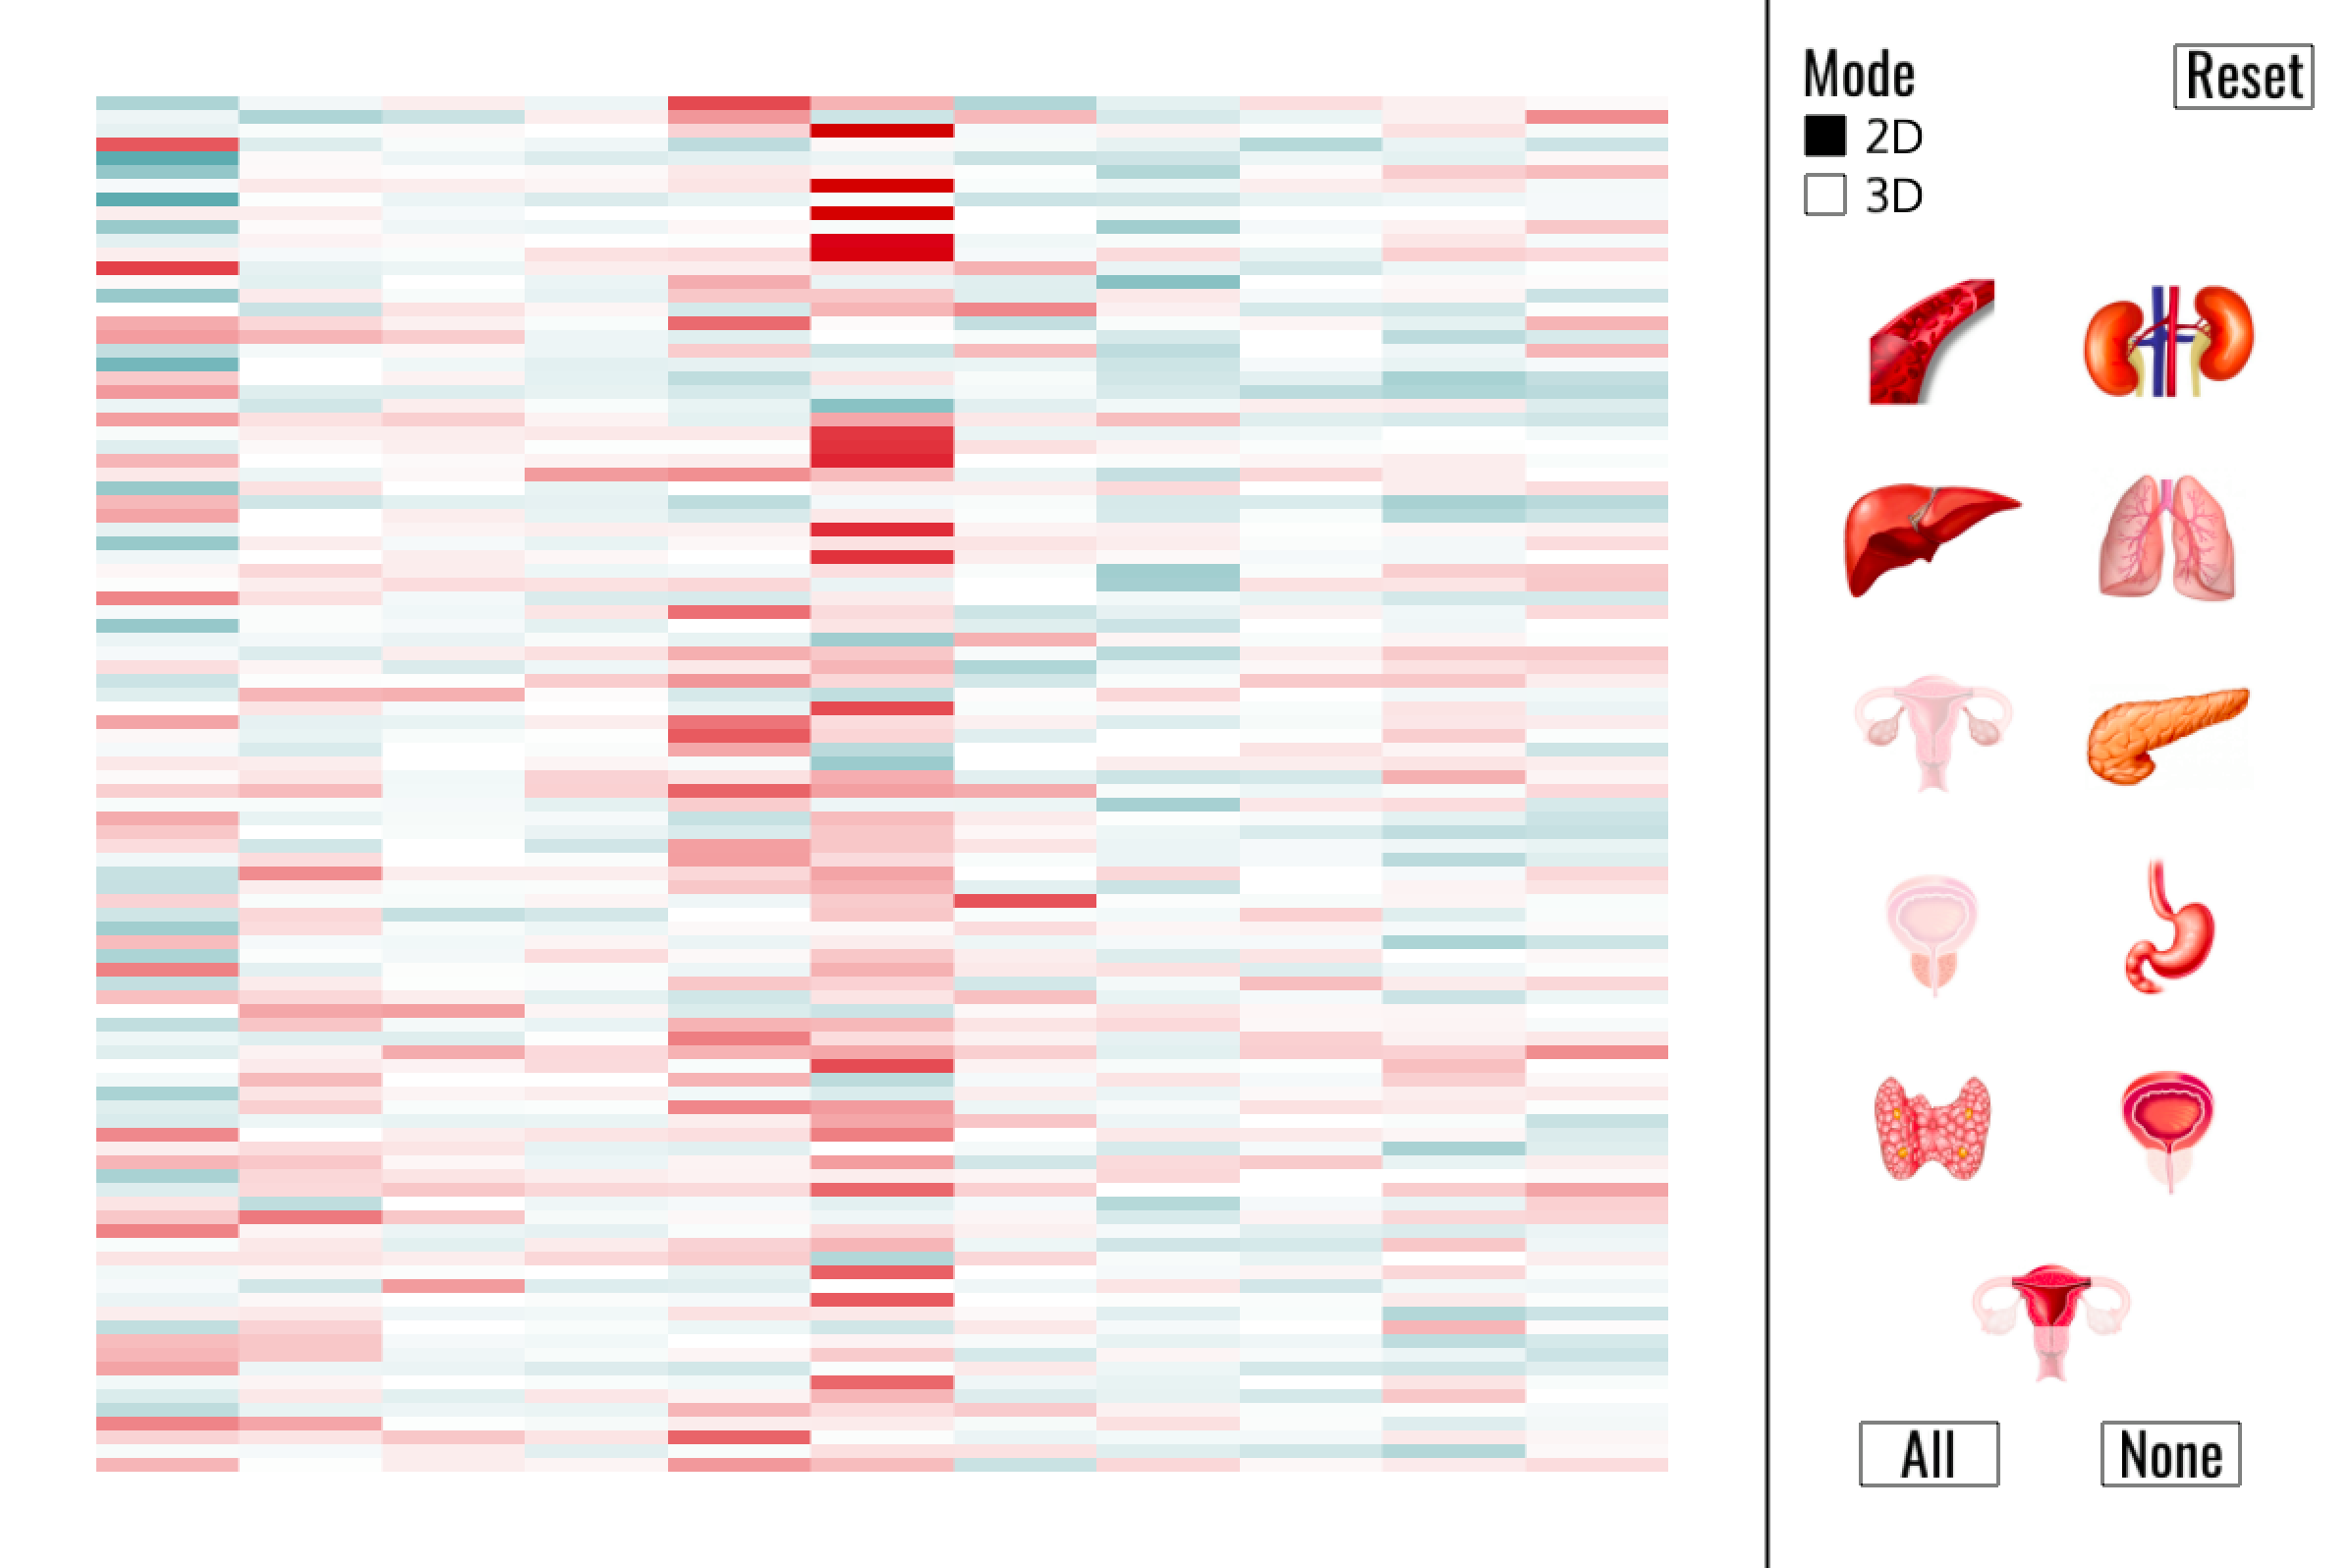
Consider a gene G. The expression of G might be different for a person with cancer a healthy person. The fold change is a measure of this. Fold changes are interpreted as follows:
| Fold Change for G | Interpretation | |
|---|---|---|
| Positive | G’s expression for a sick person is greater than its expression for a healthy person. We say G is overexpressed. | |
| Zero | G’s expression is the same for a sick person and a healthy person | |
| Negative | G’s expression for a sick person is less than its expression for a healthy person. We say G is underexpressed. |
The farther from 0 G’s fold change is, the greater the difference between its expression for a sick person and a healthy person.
If two genes G1 and G2 have fold changes of 3 and 2, then G1 is more overexpressed than G2.
If two genes G1 and G2 have fold changes of -3 and -2, then G1 is more underexpressed than G2.
For these heat maps, it might help to think of each gene as a character that might play different roles for different contexts (different types of cancer). The genes together form a society that functions differently from one context (type of cancer) to the next.
The dataset for these heat maps is from the Pan-Cancer Analysis of Whole Genomes (PCAWG). We sourced it from https://www.ebi.ac.uk.
For comments, suggestions, and concerns, please email mallari.juan_carlo.md7@is.naist.jp.
List of images used here
Copyright © Peinto Gen 2018. All Rights Reserved.
A theme by Dcrazed