PeintoGen is a gene expression data visualization website designed to be a supplementary educational tool for students of biology and a tool to introduce interested members of the general public to the field of gene expression analysis. It seeks to provide information in an accessible manner and to modify existing data visualization strategies to make them more approachable and engaging.
PeintoGen focuses on a field known as transcriptomics. This might be the first time you have encountered the term, and that's okay! We have prepared an encyclopedia to give you the biological background necessary to explore the site with confidence and ease.
In exploring the following visualizations, we would like you to focus on how they are able to summarize data (paint the big picture), not on the identities and actual biological functions of the individual genes.
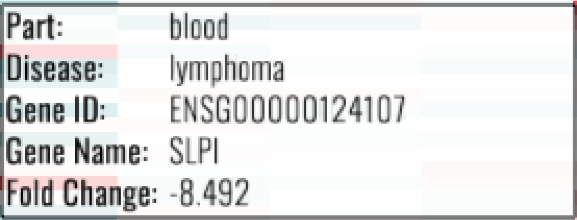
In your exploration, you will see information like this:


You are free, of course, to try and understand what each gene is for, but we aren’t putting pressure on you to do so.
For comments, suggestions, and concerns, please email mallari.juan_carlo.md7@is.naist.jp.
List of images used here
Copyright © Peinto Gen 2018. All Rights Reserved.
A theme by Dcrazed